Introduction
A distributed system is one in which the failure of a computer
you didn't even know existed can render your own computer unusable

- Leslie Lamport
The fact of life is we’re building bigger, more complex and distributed systems. What used to be single server serving old-style personal home pages turned into the medium.com mediated blog post and various other ecosystems. Simple bulletin board marketplace turning enormous systems of Amazon, eBay, and other online retailers. This evolution is akin to life itself, as we progress from single cellular bacterias to humans we’re today, the thing got complicated. More powerful, but complicated.
Now, let’s talk about your current system. Chances are not everything is new. Today almost every system uses numerical routines written in Fortran a few decades ago. Similarly, in your bodies basic cell metabolism haven’t changed last 100s million of years.
Though with added complexity, some things did change. Aside from superior featureset, e.g. sight, speech, consciousness we evolve advanced monitoring equipment. Just a single neuron acting and proto-eye doesn’t cut it, but a full-fledged eye does.
Vast nerve network almost instantaneously detects issues in your body and alerts the control center. Imagine if you had to check every second did you stub your toe or are you bleeding?
Messages are sent and received via hormones on the gigantic message queue called circulation system, i.e. blood. Much bigger complexity than simple single cell organism and osmosis diffused operations.
Therefore, your new systems cannot be monitored as they were during lower complexity era. Logs aren’t enough anymore, neither are metrics nor pprof and similar toolset. In this article, I’m presenting tracing as another tool in your toolbox, both in monolith application and distributed setting. A very useful tool for specific use cases.
Observability toolset
In this chapter, I’ll briefly cover basic observability tools at our disposal. I’ll also use a football analogy as a metaphor for the clearer explanation. For those familiar feel free to skip to the latest section, tracing.
Logs
log - an official record of events during the voyage of a ship or aircraft
This is the simplest and most basic tool at our disposal. One log represents some event happening with associated metadata.
The most common metadata is when did the event happen, and other which application generated this event, on which host, what’s the level of this log event.
Usually log event levels are modeled after syslog levels, DEBUG, INFO, WARNING, ERROR, CRITICAL being used the most in the software.
On the application and system level, you usually have log sources and log sink. Each source generates log data, and ships it to sinks. Each sink can apply some fileting, e.g. only ERROR level or higher.
In practical terms this means you’re writing log level INFO or greater to stderr, but to the file, you’re dumping all logs.
There are log management systems for gathering and searching logs. One of the simpler is logfile with grep, more complex being journaling in systemd, and for production distributed systems you’re usually using ELK stack or graylog.
In the football analogy, playing scoring the goal would be a great log. Something like:
msg="Ivan scored the goal" time="2018-01-12" game_minute="23"
The log data is useful for unique, rare events or somehow meaningful events. For frequent events, it needs to be sampled down not to kill your log management system. For example, do you want to log every time you received IP package on the server?
Metrics
metric - a system or standard of measurement
In observability context, metric is scalar value changed over time. This scalar value is usually a counter (e.g. number of goals scored, HTTP requests), gauge (e.g. temperature, CPU utilization), histogram (e.g. number of 1xx,2xx,3xx,4xx,5xx HTTP response codes) or rank estimation (e.g. 95% percentile response latency).
They are great for identifying the bottleneck, unusual behavior and setting SLOs(Service level objectives). Usually, alarms are tied to some metric, that is whenever the specified metric is outside given bound perform an action - auto-heal or notify the operator.
For example, in human, we have a really important metric - blood glucose level. In a healthy human, too high value performs an auto-healing operation and releasing more insulin into our bloodstream. Another human metric would be pain levels in your left leg. Usually, it’s near 0, but over the certain threshold you’re vividly aware of it – that is an alarm is raised.
For computer systems, usual metrics are related to throughput, error rate, latency, resource (CPU/GPU/network/…) utilization. Usual systems mentioned are statsd, graphite, grafana, and Prometheus.
Pprof & Flamegraphs
This tool is best for profiling CPU intensive applications. Before I explain what it offers you I want to cover how it works. X times per second it stops your program and checks which line is being executed on the machine. It collects all execution samples into buckets per line/function and later on reconstructed which function/line was executed which time %. As if you’re snapshotting the football match and see who has the ball every 10 seconds, and from that reconstructing who had which ball ownership percentage.
Traces
If you remember anything from this blog post, remember this comet image:

As is burning through Earth’s atmosphere it leaves a trace over its path. From this trace we can deduce where it has been and how much time is spent there. A similar situation is within our programs.
The trace represents single execution of request/operation. Trace is composed of multiple spans. Span is a meaningful unit of work in your system – e.g. database query, RPC call, calculation. Span can be related, e.g. parent/child span. Thus trace forms a tree of spans, or more generally a DAG (if you introduce complex followed by relations and other gimmicks).
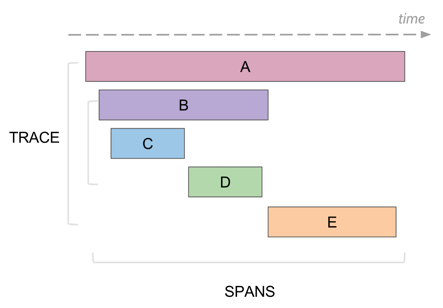
Each span can have useful metadata attached to it – both indexed tagged key/value pair such as userId, http.statuscode, hostname or additional log data e.g. exact database query. The tracing backend provides expected search capabilities, sorting by time, filtering by tags, etc.
In football example, we could have a trace representing scoring a goal. It consists of 3 spans:
- Ivan kicking the ball
- The ball rolling to the goal
- Ball entering the goal post
Common use cases
In this section, I’m going to cover top use cases for tracing. Compared to other techniques like pprof, tracing can detect when your program was put to sleep due to IO waiting, resource contention or other reason.
Overall request overview
It allows you making a case study from an individual trace. Metrics aggregate while trace focuses the story on the individual request. What services did this individual request touch? How much time did it spend there? What’s the time breakdown on CPU, GPU, network calls, etc.
If you’re debugging your application searching through your traces for specific edge case and analysing that one is golden. Same with analyzing performance outliers.
Big slow bottleneck

When you got obvious bottleneck you know where you need to drill down. You’ve narrowed down your search space to this particular operation.
The causes for big slow bottleneck could be various. Perhaps you’re overusing lock and the program is waiting on one. Or the database query is underoptimizes/missing an index. Finally, your algorithm worked for 10 users but after growing to 10 000 users it’s just too slow.
Find it, observe it, analyze it, and fix it.
Fanout
Fan out is the number of outgoing requests a service makes for each incoming requests. The bigger the fan out the bigger the latency. Sometimes fan out is on purpose and useful, however in this context, we’re primarily talk about calling the same service over and over again where a bulk operation would be more suitable.
It’s the difference between:
SELECT id, name
FROM users
WHERE ...
versus looping over some id list and querying for each id:
SELECT name
FROM users
WHERE id = $1 AND ...
This could happen inadvertently, e.g. using ORM framework deciding to do this thing. You’ve fetched your ids and now you’re happily looping over them not knowing you’re issuing new database query each time.
Other times it’s the issue with API design. If you have internal API endpoint such as: /api/v1/user/{id} for fetching user data, but require bulk export it’s the same issue.
On the tracing, you shall see many small requests to the same service. Despite them being parallel (though they’re not necessarily) you shall hit tail latency problem.
The probability you’re going to observe p-th percentile latency for the calling services drops exponentially with fanout degree. Here’s a simple figure illustrating it.

Chrome tracing format
This is simple JSON format specification for single process tracing. The catapult project includes the rendered for this specification. The same renderer available in chrome under chrome://tracing/ URL. There are various support for spitting out this format, e.g. tensorflow execution, golang tracing, chrome rendering itself, etc. And it’s easy to include it into your application if there’s no need for distributed tracing and your requirements are simple.
For example, this simple file:
[
  {
    "name": "Asub",
    "cat": "PERF",
    "ph": "B",
    "pid": 22630,
    "tid": 22630,
    "ts": 829
  },
  {
    "name": "Asub",
    "cat": "PERF",
    "ph": "E",
    "pid": 22630,
    "tid": 22630,
    "ts": 833
  }
]
Renders as:

If you’re interested in more I recommend at least skimming the specification. The biggest downside is working with the visualizer. As a newcomer, I had a hard time finding how can I filter datapoint in categories, by name, and overall advance use cases beyond the basic scroll and see.
Distributed tracing
All’s fine and dandy on a single node, but trouble starts with distributed systems. The problem is how to connect/correlate traces coming from multiple nodes. Which spans belong to which trace and how are those spans related?
Today most solutions take notes from Google’s dapper paper. Each trace has its own unique traceID and each span unique SpanID which are propagated across the node boundaries.
Though, there are multiple ideas about how this context should be propagated and whether to include additional data during that propagation (i.e. baggage). Also, each backend has its own ideas how should you deliver trace/span data to them.
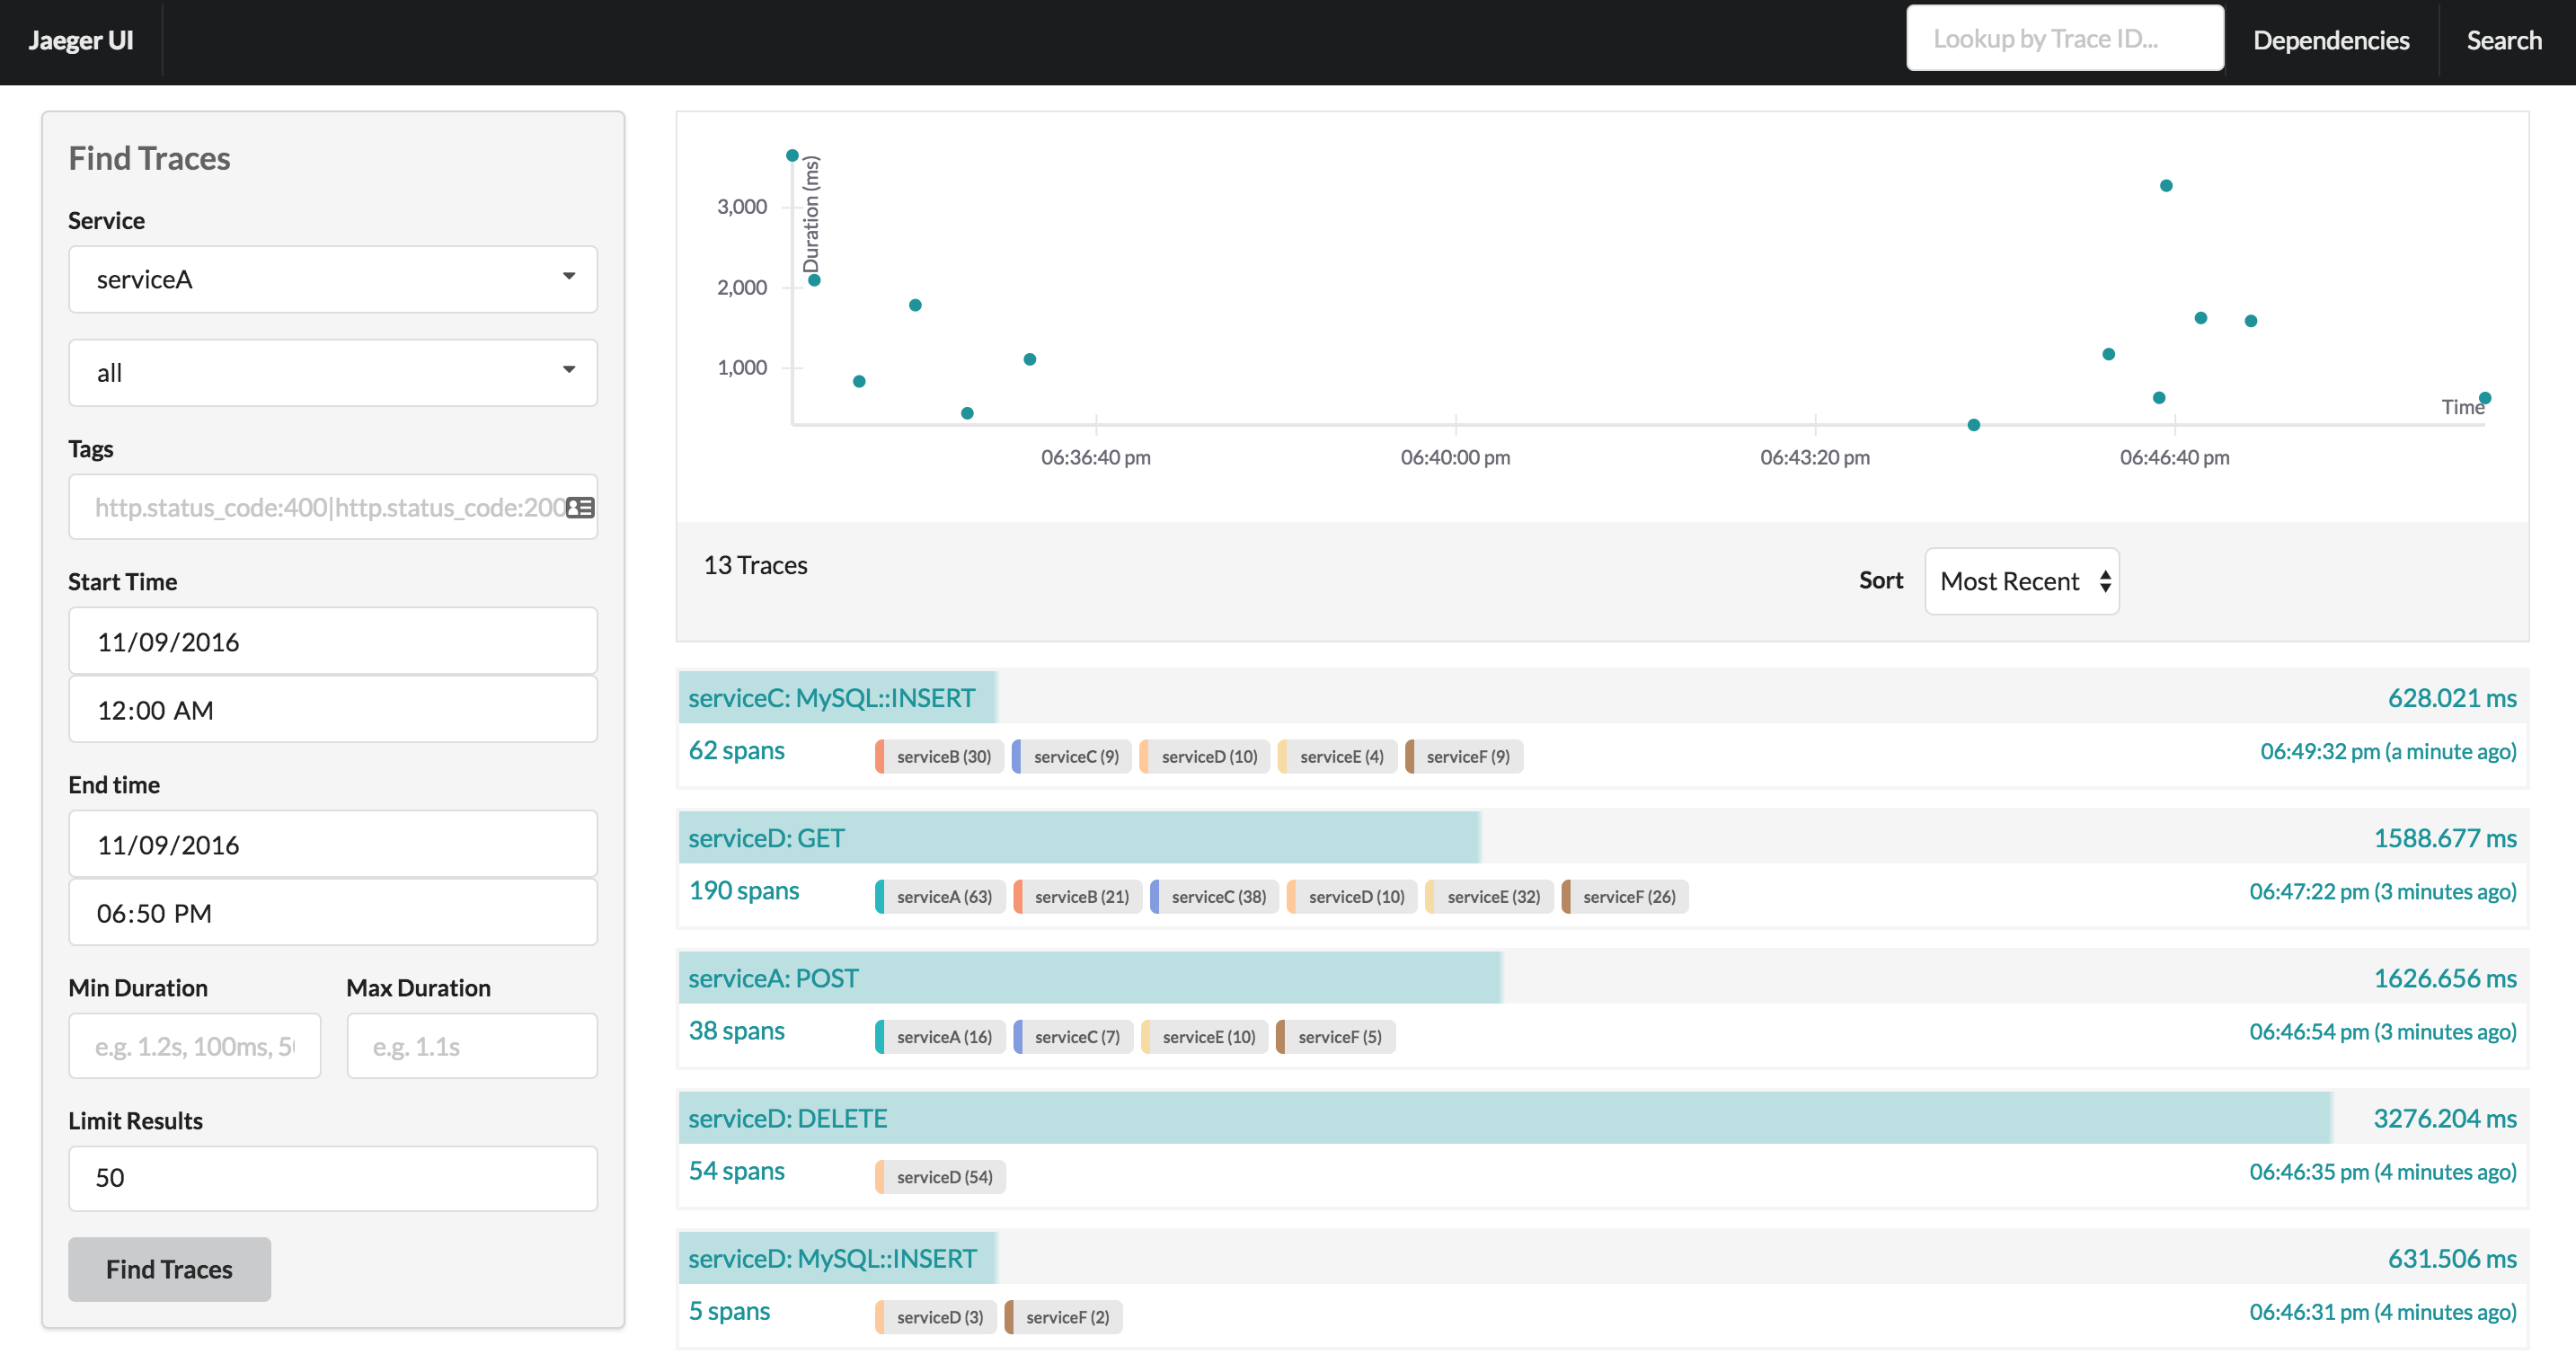
The first available backend was Zipkin, nowadays Uber’s Jaeger is now CNCF incubating project and a good place to start. Also, various cloud providers have their own in-house SaaS tracing (Google’s stackdriver, AWS X-Ray, etc.)
Here’s a screenshot from Jaeger frontend for searching and looking at your traces:
Since writing against specific backend could be a hard vendor lock-in, there have emerged two client vendor-neutral APIs – open tracing and open census.
Client side vendor-neutral APIs
In this subsection, I’m going to compare open census and open tracing standard. Both are evolving project with high GitHub start count, multi-language support with various middleware implementations for databases, HTTP’s RPCs, gRPC, etc.
Open tracing is currently CNCF incubating project while Open census emerged from Google’s internal trace tool. Nowadays open census has its own vendor-neutral organization.
As for the feature set, the open census includes metrics inside its API while open tracing is metrics only.
In open census, you add trace exporters to the global set, while in the open tracing you have to specify them in each iteration. They have global tracer concept, but at least in go’s they don’t offer to default on it, but you have to invoke it. Furthermore, open tracing API feels more clunky and less polished compared to the open census.
For the propagation format, open census specify the standard. Open tracing on the other hand only specifies the API, and each supported backend much implement the standard propagation API.
What open tracing has is baggage concept, that is forcing some data to be propagated to each downstream service alongside span propagation context.
Open census example
This subsection shall describe basic open census building blocks. For complete examples see their official documentation, it’s quite good! They even feature great examples. My examples are in go, but they support multiple other languages. For brevity import statement shall be omitted.
First we start by defining trace exporter:
j, err := jaeger.NewExporter(jaeger.Options{
        Endpoint:    "http://localhost:14268",
        ServiceName: "opencensus-tracing",
})
trace.RegisterExporter(exporter)
We can easily start it using Docker. From their getting started page
docker run -d --name jaeger \
  -e COLLECTOR_ZIPKIN_HTTP_PORT=9411 \
  -p 5775:5775/udp \
  -p 6831:6831/udp \
  -p 6832:6832/udp \
  -p 5778:5778 \
  -p 16686:16686 \
  -p 14268:14268 \
  -p 9411:9411 \
  jaegertracing/all-in-one:1.7
Then we start some span:
ctx, span := trace.StartSpan(ctx, "some/useful/name")
defer span.End()
The ctx is instance of standard’s library context.context
We can attach some indexed tagged key/value metadata to this span:
span.AddAttribute(trace.StringAttribute("key", "value"))
Open tracing actually specifies some standardized keys (e.g. error, http.statuscode, …). If you can I recommend using them despite open census not specifying any.
Or we could add some log data, that is annotations:
span.Annotate(nil, "some useful annotation")
span.Annotate(
    []trace.Attribute{trace.BoolAttribute("key", true)},
    "some useful log data",
)
After we decided to use http let’s inject open census middleware:
client = &http.Client{Transport: &ochttp.Transport{}}  // client
http.ListenAndServe(addr, &ochttp.Handler{Handler: handler}) //server
for client side we only have to include the right context into our request:
req = req.WithContext(ctx)
resp, err := client.Do(req)
While on the server side we grab the context from the request and go on with our life.
func HandleXXX (w http.ResponseWriter, req *http.Request) {
    ctx := req.Context()
    // ...
}
This chapter could be summarised as open census crash course/cheat sheet/in 5 minutes.
Summary
To summarise this blog post I recommend tracing for these use cases the most:
- Reasoning about overall performance overview
- Detecting big slow operations
- Fan out detection
In here I presented various tools such as chrome tracing format, open tracing, and open census. Of those, I recommend starting with open census and starting jaeger in a docker container. Use middleware wherever possible.
Finally, reap the benefits! See how tracing benefits you and how can you best leverage it to your success.
Reference & links
- My Webcamp 2018 talk for this blogpost
- Chrome tracing format specification
- https://www.jaegertracing.io/docs/
- https://github.com/catapult-project/catapult
- https://medium.com/@copyconstruct/monitoring-in-the-time-of-cloud-native-c87c7a5bfa3e
- https://opencensus.io/
- http://opentracing.io/
- GOTO 2016 • What I Wish I Had Known Before Scaling Uber to 1000 Services • Matt Ranney:
- How NOT to Measure Latency by Gil Tene:
- So, you want to trace your distributed system? Key design insights from years of practical experience